Extracting n8n Workflow Node Execution Times and Displaying in Grafana
-
demodomain
- . March 9, 2025
- 3,789 Views
-
Shares
The Challenge
I wanted to extract accurate execution times for all nodes in all my n8n workflows, including cases where nodes run multiple times (either due to loops or because they’re sub-nodes like “Postgres Chat Memory”).
Initial Attempts
- I started with a simple approach that matched nodes to execution times by position, but this failed for nodes that ran multiple times.
- I then tried to identify multi-run nodes by looking for patterns in the JSON structure, focusing on:
- Nodes with “inputOverride” in their execution data
- Run index information (e.g.,
{ "node": "88", "runIndex": 0 })
- I created a code node to map node references to actual node names, but couldn’t reliably determine which node references corresponded to which nodes.
The Breakthrough
The key insight came when I analyzed the raw JSON structure and noticed:
- In the JSON at index 2, there’s a “runData” field that points to the main node mapping.
- Each node in this mapping has a reference number that points to an array.
- The length of this array indicates how many times the node ran.
For example:
Copy"Postgres Chat Memory": "14"  // Points to index 14
parsedData[14] = ["23", "24"] // Array with 2 items = node ran twice
The Final Solution in Three Steps
Step 1: Node Run Analyzer
- Locate the node mapping using the “runData” reference
- For each node, check its referenced data
- If that data is an array, the length tells us how many times the node ran
- Identify nodes that ran multiple times
Step 2: Expanded Node List Builder
- Create an expanded list with one entry per node execution
- For nodes that ran multiple times, include multiple entries with different run indices
- Verify that the total matches the number of execution time objects
Step 3: Execution Time Matcher
- Match each node in the expanded list with execution time objects in order
- Output the final results with node names, execution times, and run indices
- Include a summary of multi-run nodes
The Result

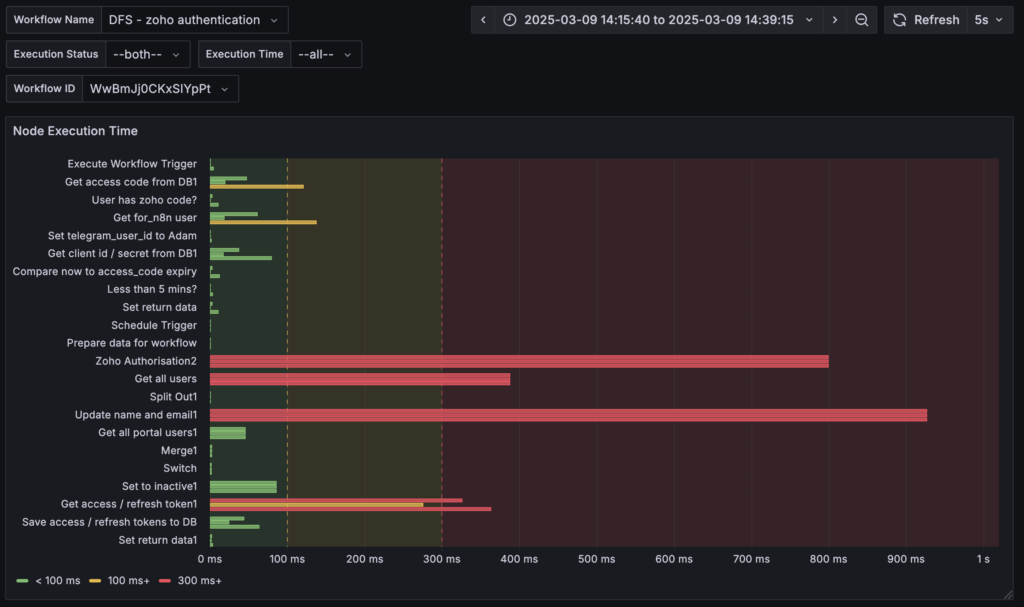
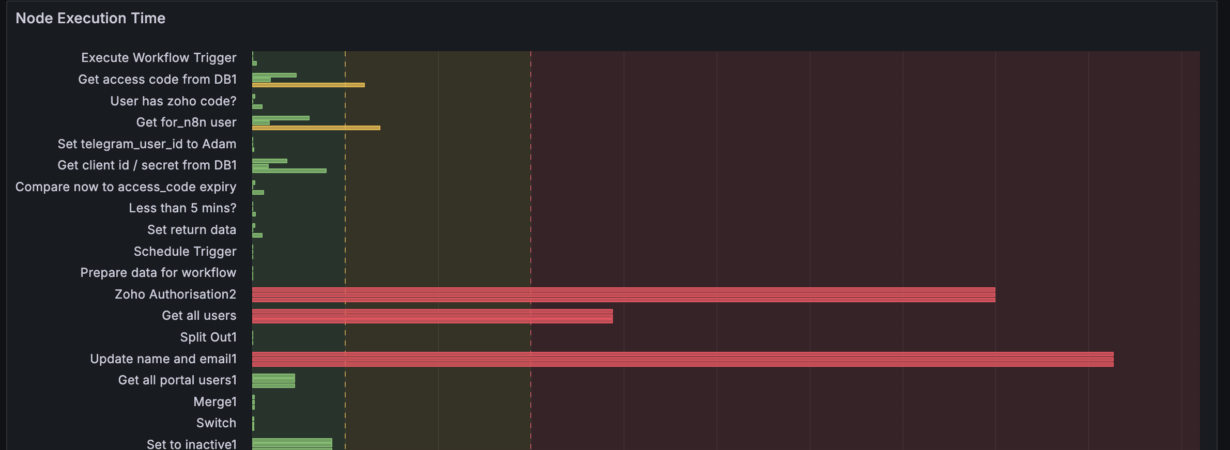
So above, that’s a Grafana panel showing the min, max, and mean of each node in a selected workflow.
My next step is to show that data based on the time-range selectors in the Dashboard and then, display a chart of node performance over time 🙂


19 Comments